
Ready to Tell Data Stories?
You’ve unlocked access to 20 Lessons on Data Storytelling.
Each 5-10 minute lesson can be access using the links below. Download our PDF Overview to save or share with your friends.
Part 1a: Understanding Charts
Chart Pieces: Learn the different components that make up a high-functioning chart
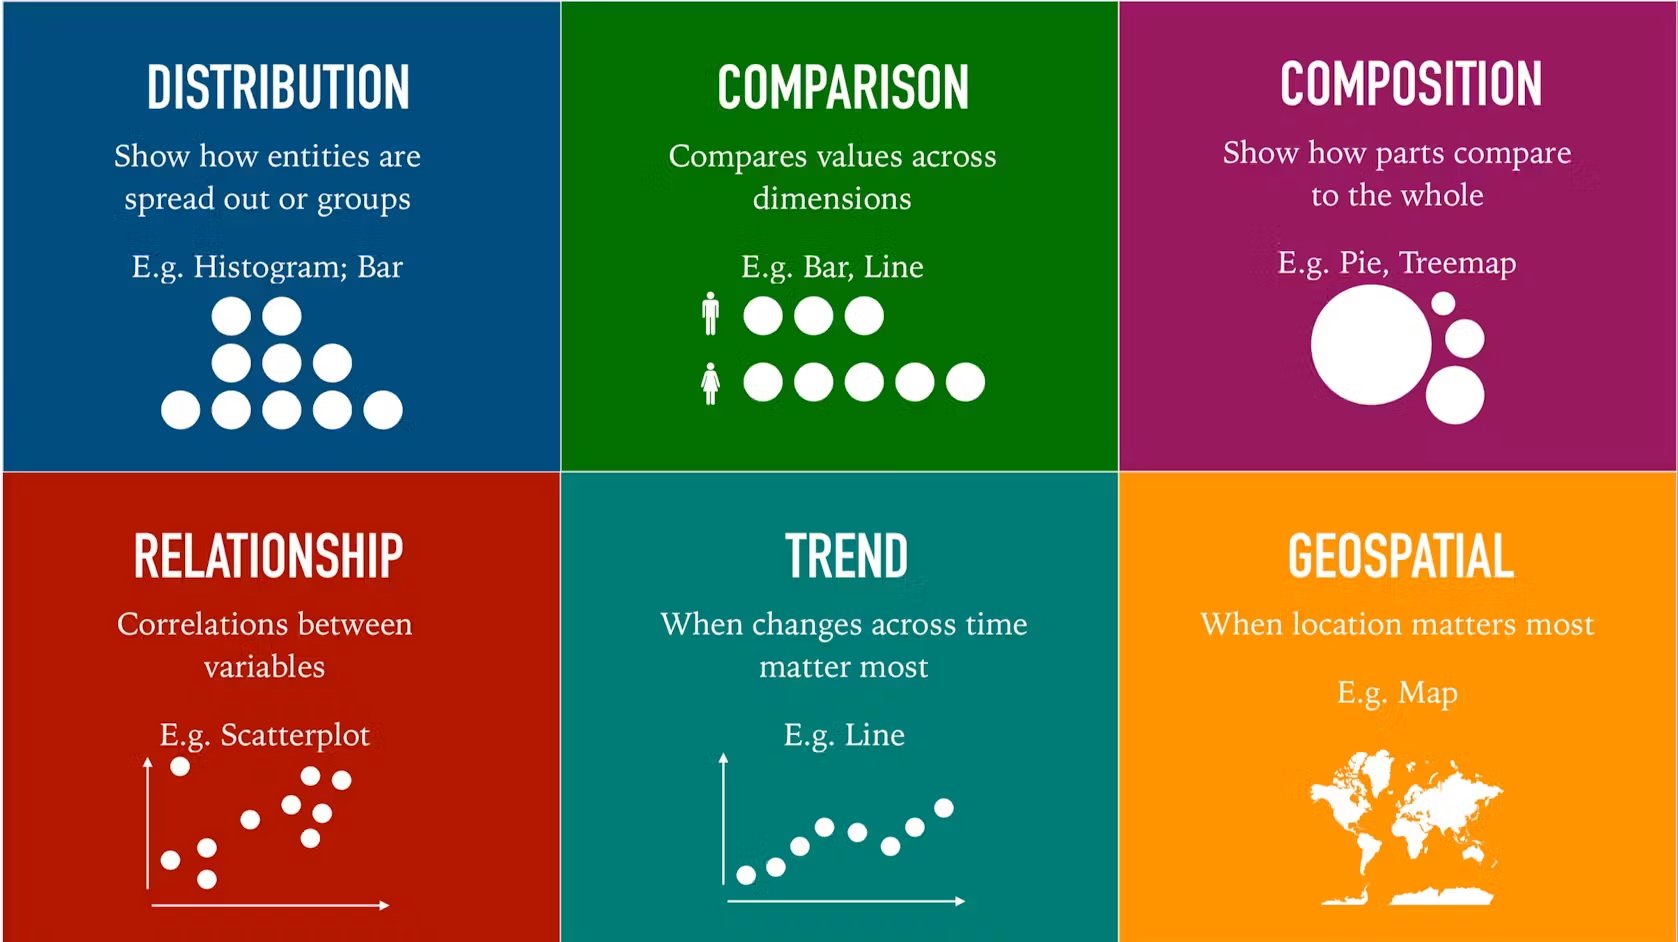
Choosing the Right Chart: What is the right chart for my data and message?

Part 2: Visual Design
Color and Contrast: How to use color and contrast to convey meaning in data and guide attention
Chartjunk: How to remove visual distractions so your data can tell its story
Typography: How to use typography design choices to support your data story

Part 3a: Story Foundations
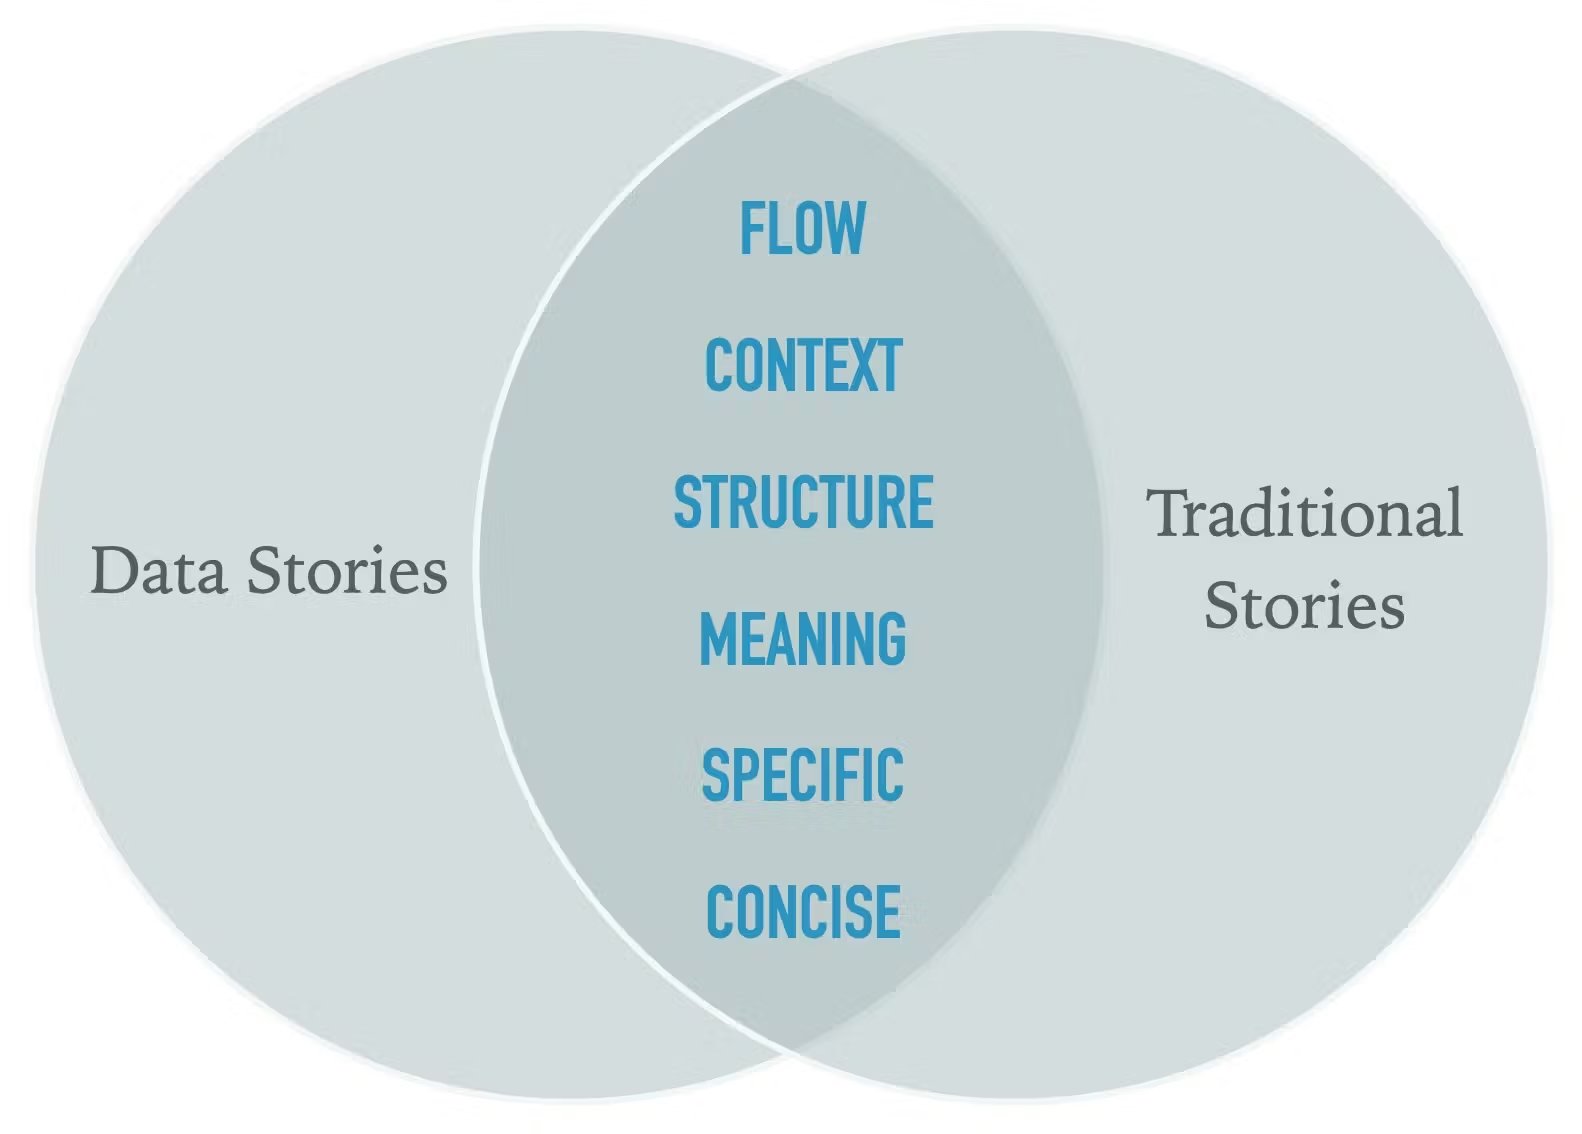
Story Elements: How to apply the elements of traditional narrative storytelling to data stories
Explore vs. Explain: A lesson in the relationship between exploratory and explanatory data analysis
Data Personality Profiles: Explore the different ways dashboards serve audience needs
Part 3b: Narrative Flow
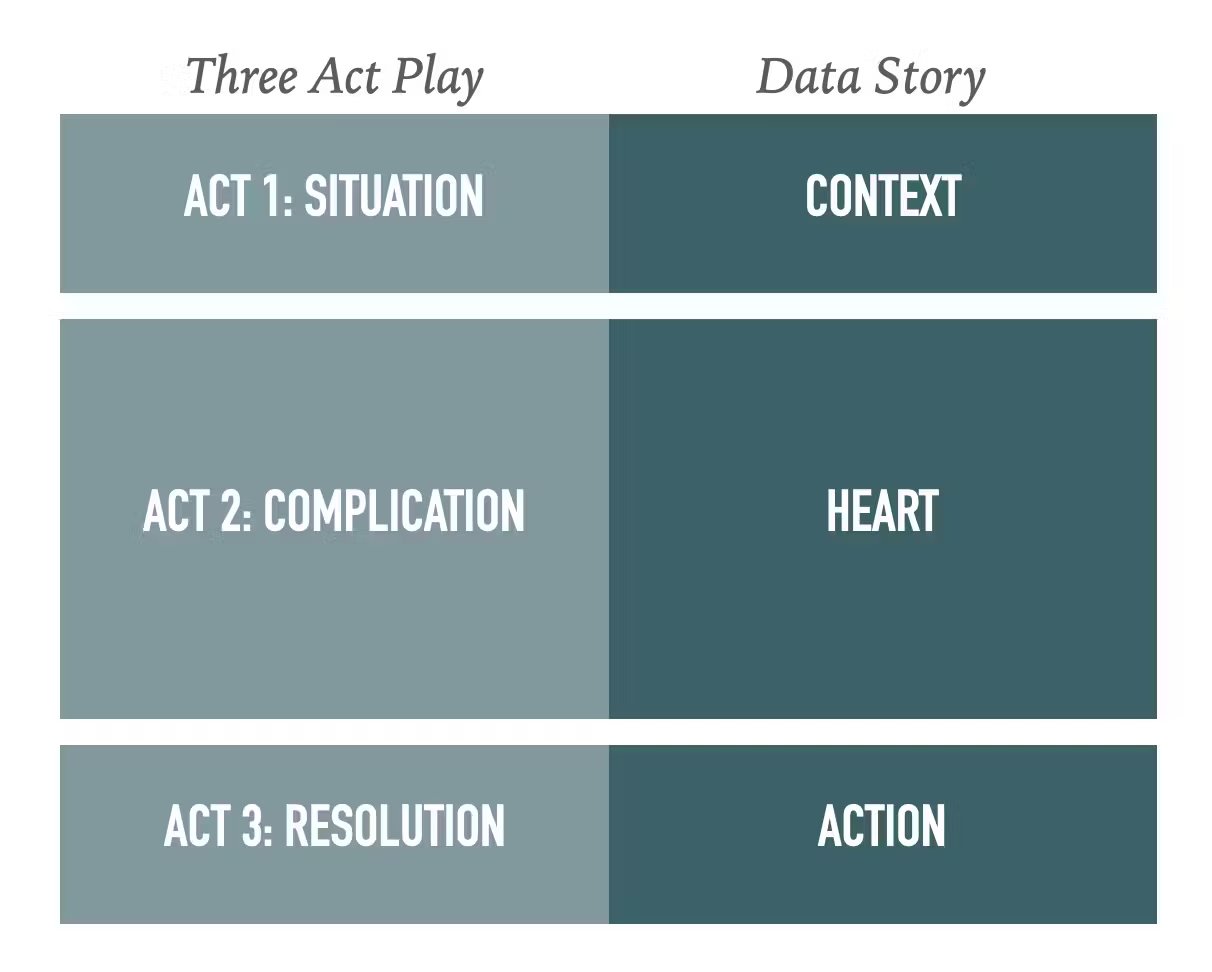
Story Structure: How to use the traditional 4-part narrative structure to design your data story
Narrating Data Stories: How to set the context, explain charts, highlight insights, and guide your audience through your data story
Part 3c: Building Your Story
Metrics: Your Story Characters: Metrics are the characters of your data story. Choose wisely.
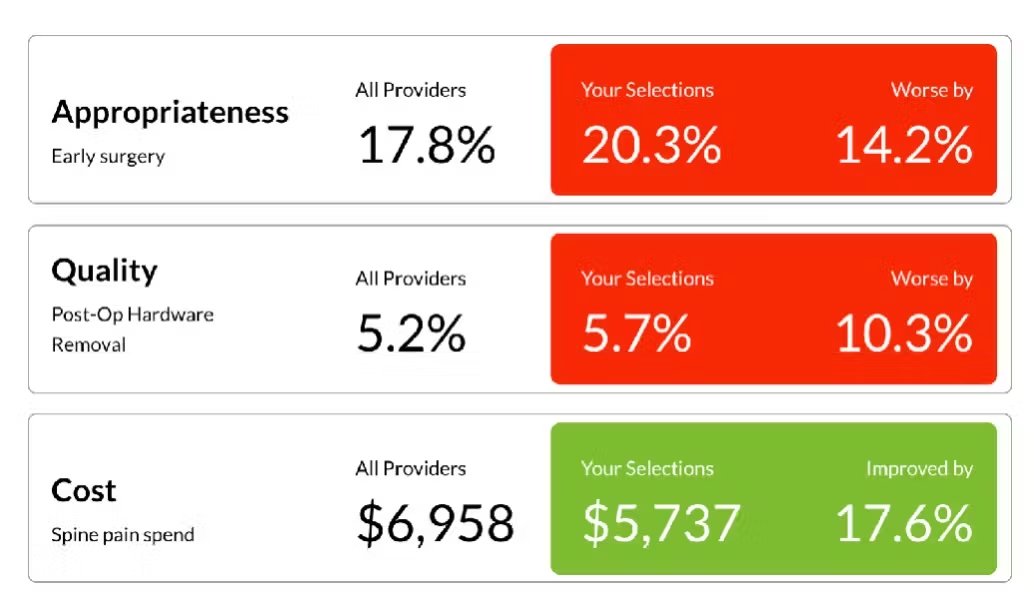
Relatable and Specific: Make your data more relatable and specific to connect with the audience
Dashboard Flavors: Explore the different ways dashboards serve audience needs
Dashboard Layout: Learning how to layout your dashboard with logic and guidance